Story Map
Battle of Verdun will be my story map along with a timeline of where each army was during the war by using lines. The story map I am going to create will consist of lines drawn on a map to indicate where the German and French were during the battle of Verdun. Also pictures that I took and pictures that I can find on the Internet to use for my story map. I am going to do research and read books on the Battle of Verdun to come up with my battle lines and description of what each army was doing during this time. The Books I will be using are Price of Glory by Alistair Horne, and two Books written Christina Holstein, Fort Vaux and Fort Douaumont. Also anything else I can find on the Internet to help better my project.
Template
For my template I am either going to use the regular story map that I first used to make my practice story map (First Story Map). This one is very easy to use and I am familiar with the program. The only problem is this map does not have a time line. I will either have to use ArcMap to edit my Battle Lines or use the add tool in ArcGIS online when creating my map layer. There is one template that I could use that would fit well for the type of story map I am wanting to create. It has a timeline that allows you to see different features on the map. Here it is: (TimeLine map). This story map (below) is of Civil War Battlefields and as you play the timeline it shows when different battles occurred on the map. This would be a great template for as I could draw lines on the map of where the French and Germans were during the war. The only problem I see with this map is the there is no room for pictures and I the user did not have descriptions for each war. I would definitely want a text box where I could type in descriptions for each front line.

Techniques
1. Original Story Map: (Overview of story map template). The first step is to go to ArcGIS online and create a map. Then being brought to map of the world then zooming in to the correct portion of the world in my case France. This map feature allows you to create an application of which template you would like. It also allows you too add layers to your map like, points, lines and anything data from ArcMap you have created. To create the story map application you must save the map and then share it to everyone. The next step is to pick a template and publish it.
 -If I am going to use this template I am going to have to draw my lines by using the add feature to edit and draw lines on my map like the picture to right. The only problem is I have not figure out how to only show one line at a time and make the descriptions of each line show up. The reason why I like this template so much is you can easily add pictures and descriptions for each picture. If my template doesn't allow for any pictures I think I will struggle to come up with successful story map.
 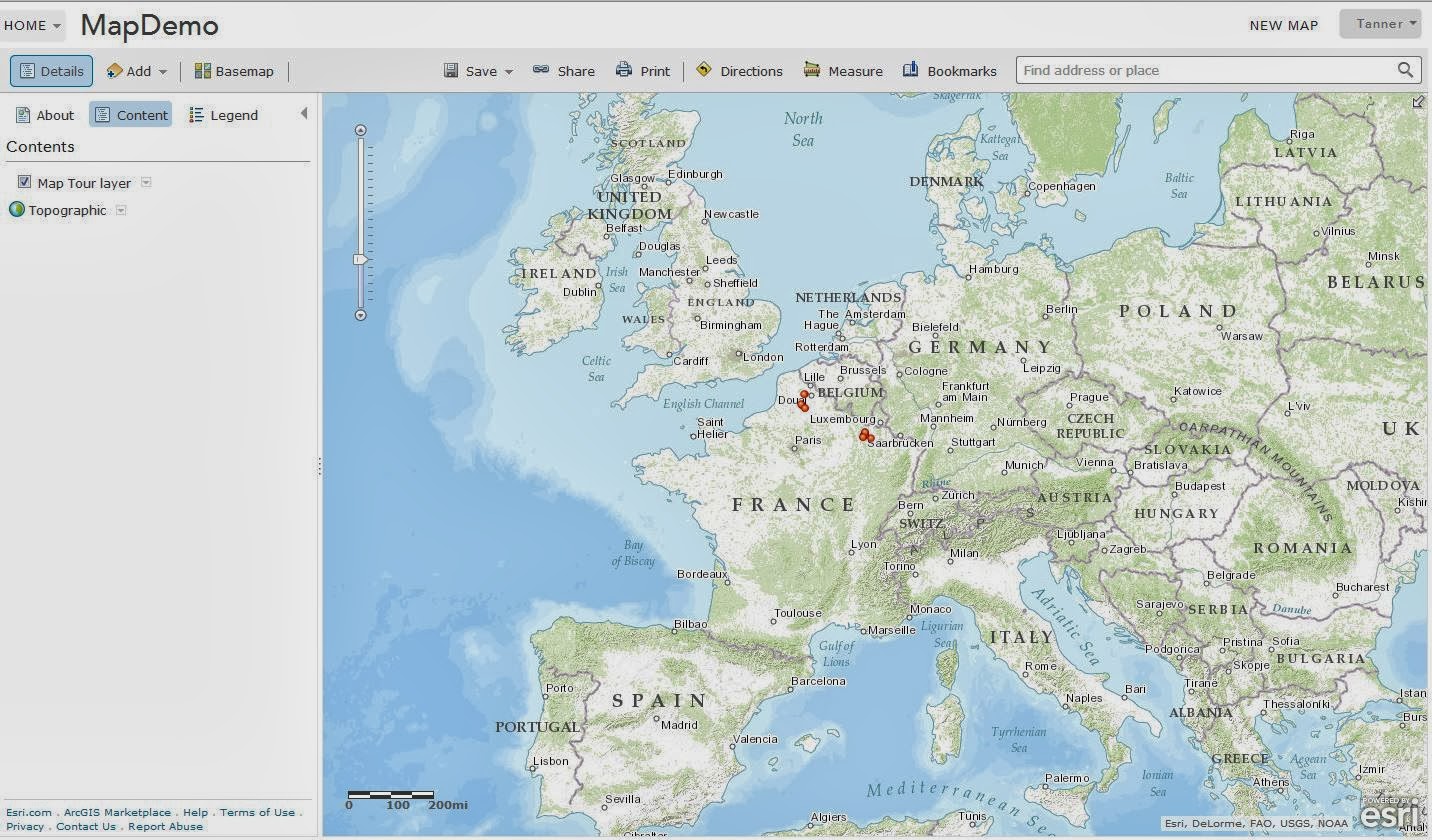 |
| The map before making the application. |
2. After publishing the template go to its home screen. Clicking the share button again is a must if you wish to edit your own story map. Then to open the application you must click open then view application and switch to builder mode.
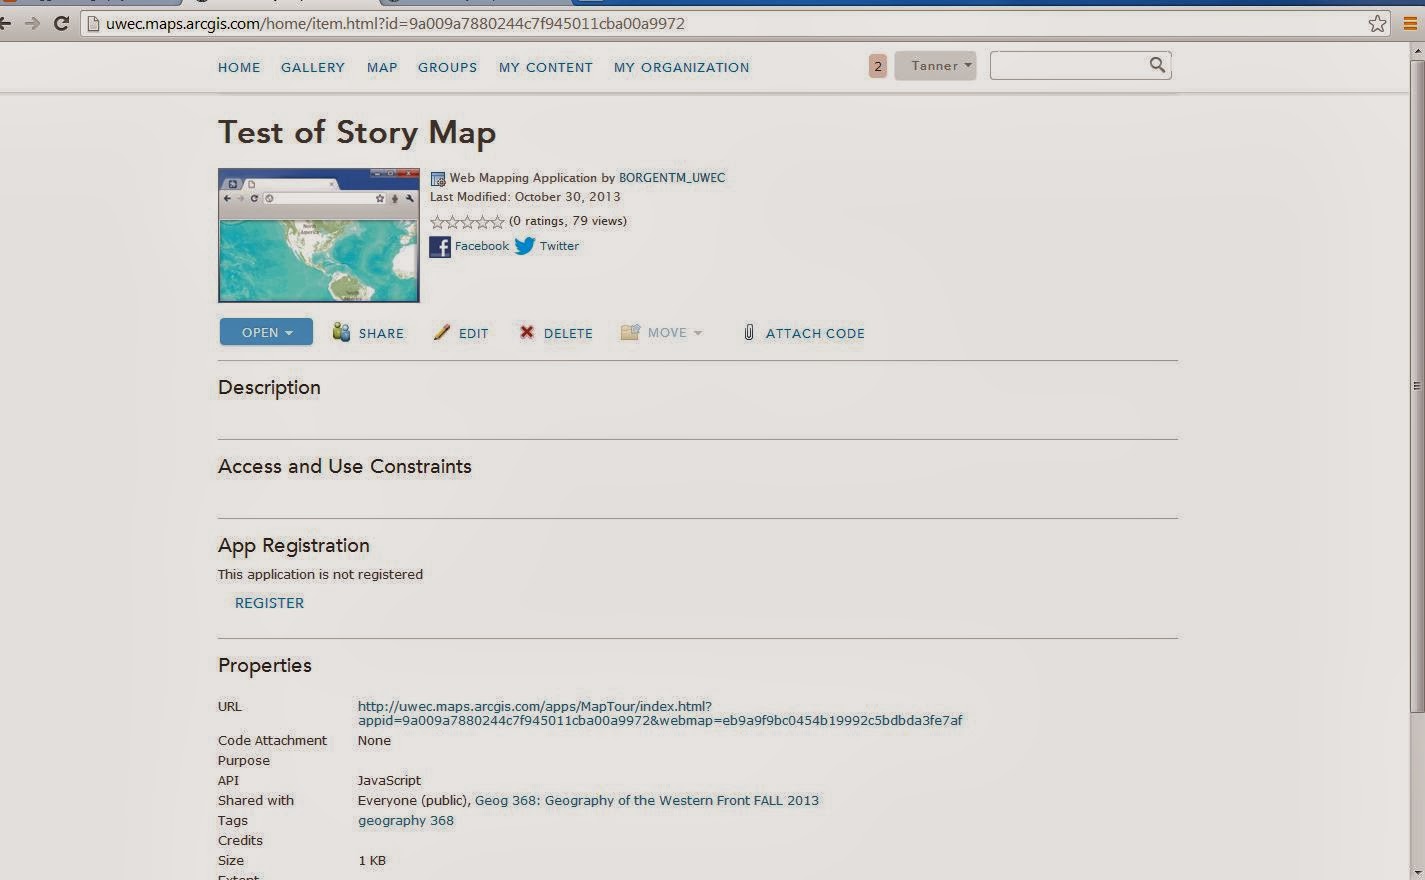 |
| Home Page of Template before the application opens |
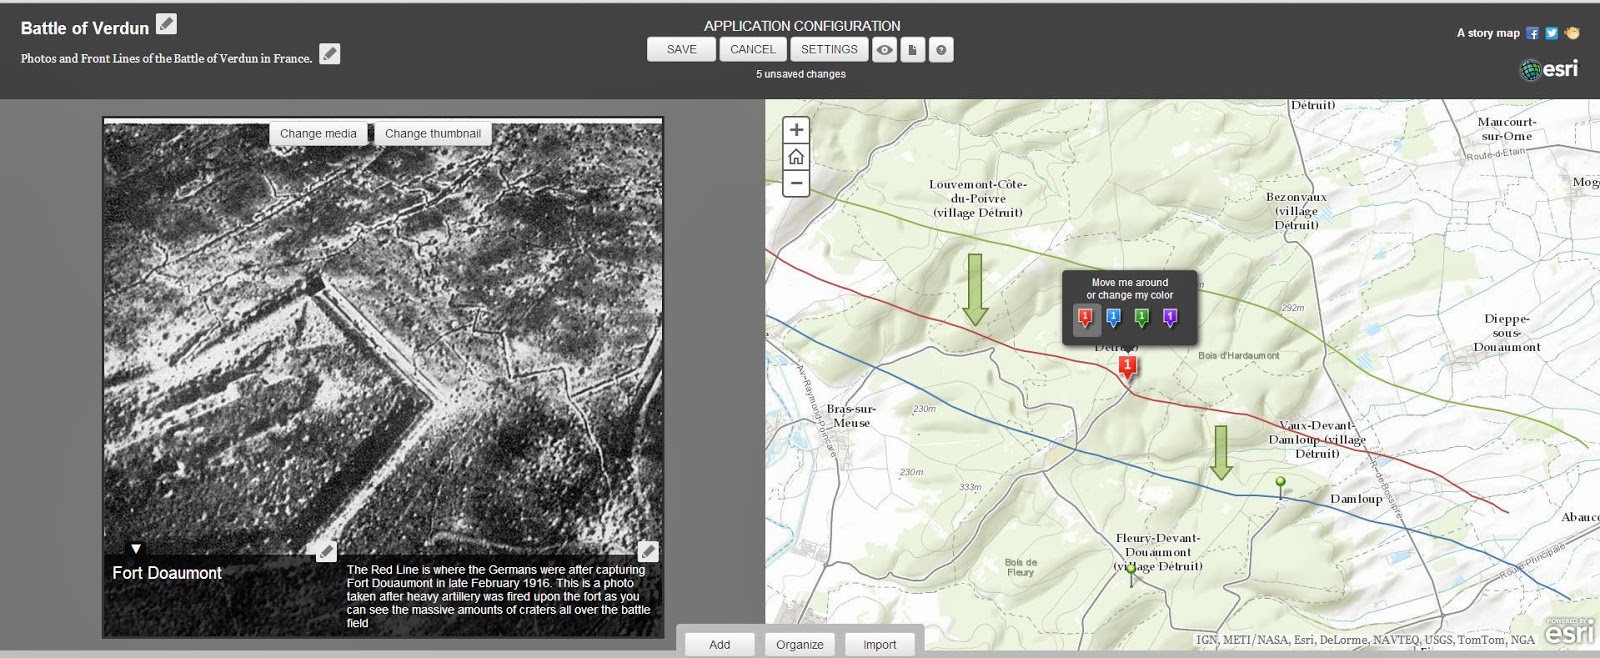
3. From here choosing start from scratch is usually the best option. You can add the pictures you want later. In this builder mode you can add pictures by clicking import from Pisca, a CVS template or Facebook. When you add your pictures you will be able to add a point to the map so it will zoom to that level, very useful when you are doing a map of traveling and have specific sites you visited. This tool allows the viewer to see where you have been and where it is compared to other places. This photo below is just an example of what a picture along side its map with the location would look like.
 |
| After adding photos you can see "edit me" which allows you to add descriptions and titles to each photo. |
4. Settings
 |
| The settings button allows you to edit your map layout, color, locations, zoom level, and header. |
CSV
This first step in creating a CSV is to download the CSV template which you can find when you create your story map and before you import pictures. When you download the CSV go to it and enter the information on the excel page. Picture name, description, color, long, lat, URL, and thumbnail URL. I created a CSV but I am not sure if I am going to use it I will probably just add my pictures through Pisca. I found this to be
 much easier then to go in and edit your excel sheet. Plus I could not figure out how to get thumbnail JPEGs. All of the ones I tried on the Internet did not work. I talked to Lee and he said he made the thumbnails through photoshop, I have not had time for that yet.
 much easier then to go in and edit your excel sheet. Plus I could not figure out how to get thumbnail JPEGs. All of the ones I tried on the Internet did not work. I talked to Lee and he said he made the thumbnails through photoshop, I have not had time for that yet.
No comments:
Post a Comment