Monday, November 25, 2013

Week 7

Project Progress

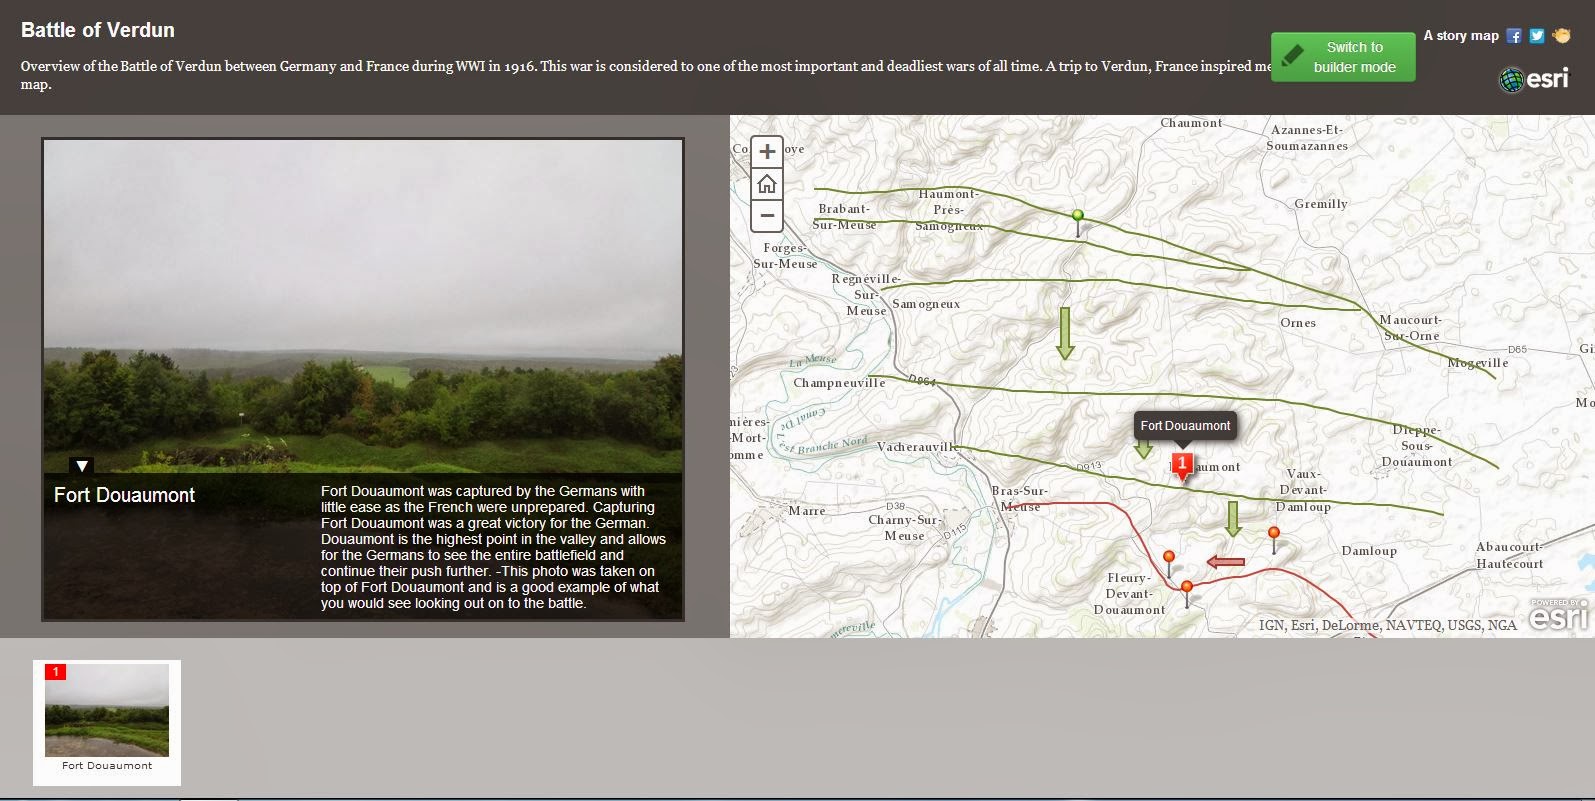
Map of the Battle of Verdun  
This week is spend time updating My interactive map of the Battle of Verdun to make it look more professional and adding detail to the map.  I also spent time finding more sources and reading to gather more information on the Battle of Verdun.  My sources can be found above by clinking on the links tab.  I found another great map of front lines during the war.  This one was very helpful because of how far the front lines stretched across the map.  I edited my previous lines and made them longer and also added more lines to my map.   


Last Weeks progress
This Weeks progress


Goals
My goals over thanksgiving break is to keep working on my interactive by adding descriptions and more map points.  I also want to begin working on my story map template I need to research for more pictures to use for my interactive and story map. 

Techniques 

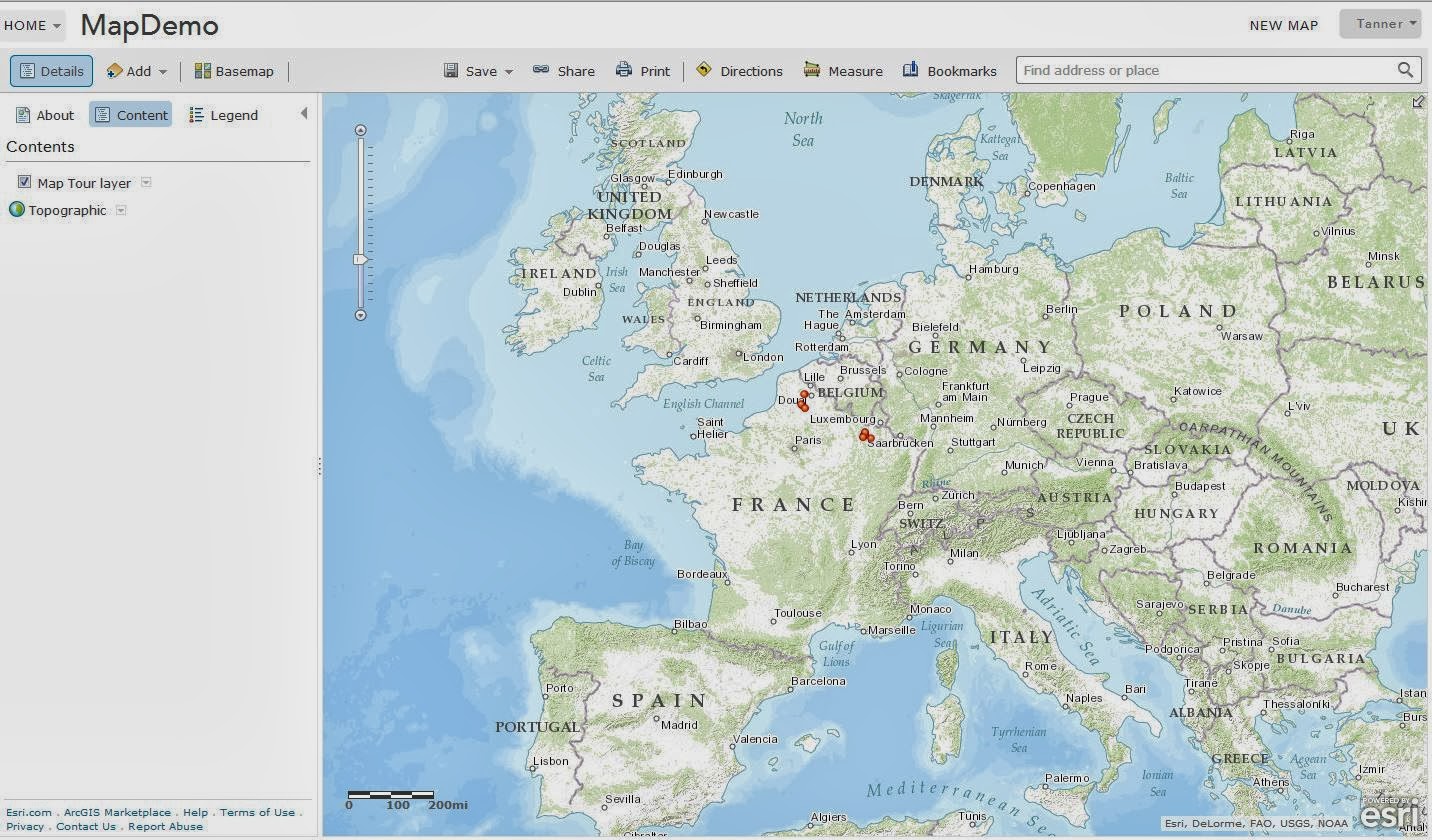
The lines, arrows, and points on my interactive map were done by adding map notes.  A step by step process of how to add these map notes will be done in this process.  The first step is to go to ArcGIS online and create an account.  In order to create an account you will need access to ESRI, the university I attend allows our students to do this.  The next step is to click on my content and create a map towards the top of the page.  After clicking this your page should like the picture to the right. 
From here you can zoom to any location you would like to fit your desired map.  You can also choose a different basemap to one that fits your eye the best.  The basemap button is found on the top left of the page.  The next step is to save and share your map.


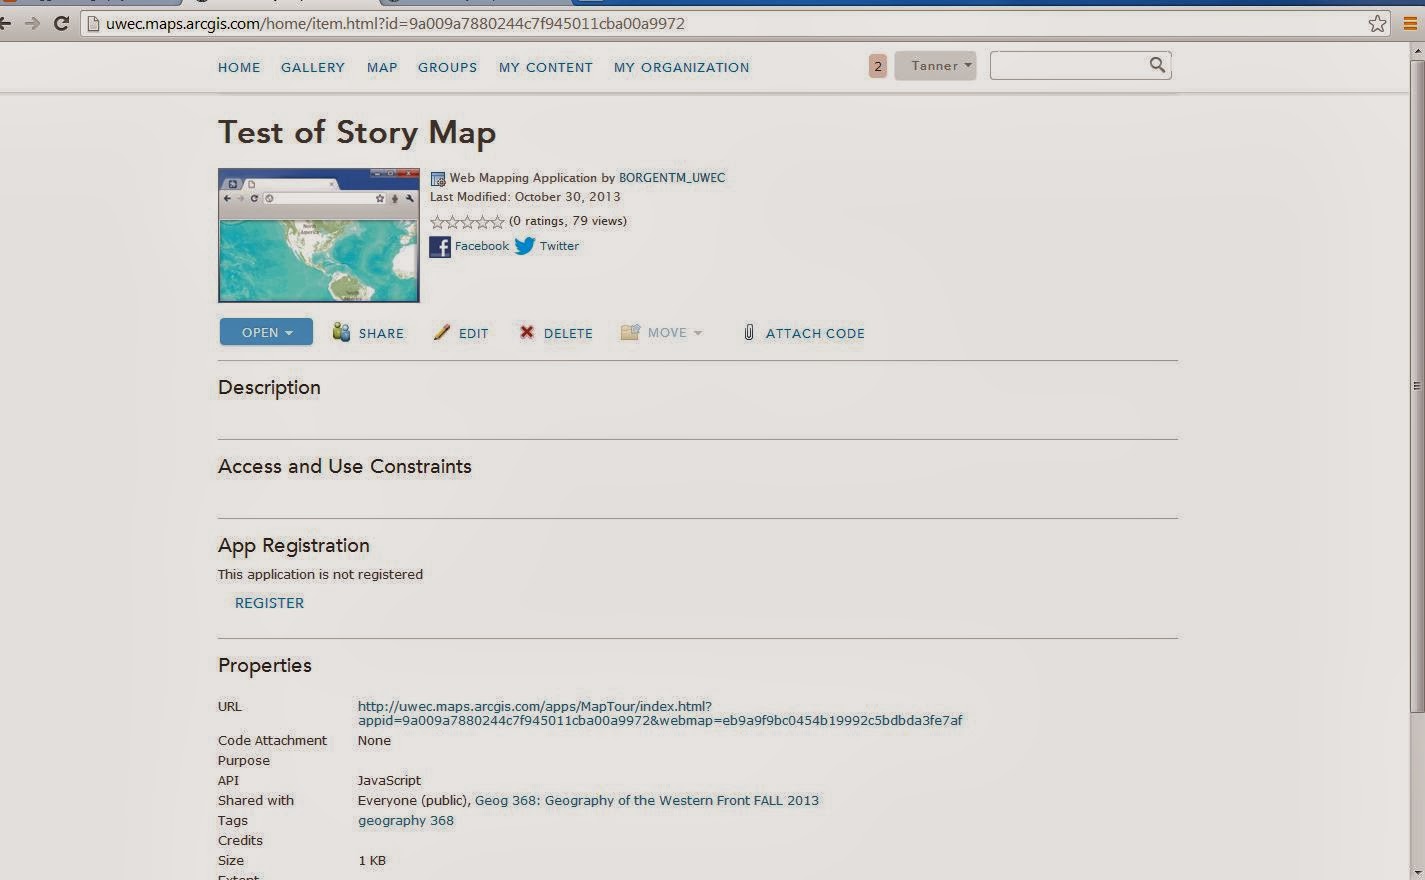
The save and share button are above the map, hit the save as button and add a title, you must add tags to the map in order to save the map.  Then clicking the share button, and choosing everyone, making your map open for the world to view.   After doing these steps you are now able to start editing your map.  To add map notes to the map you will need to click the edit button next to the basemap button and choose the 5th one down "add map notes".   From here choose a title for you map notes and you can also choose a template that fits your desire: Recreation, Park Planning, Map Notes, Civic Events, Oil and Gas Infrastructure, or Citizen Request.  After choosing one of these templates you are now ready to add dimensions to your map.  An 'add features' box should appear to the right of your map allowing you to place 
After choosing a template you are able to choose a feature
to add to your map. 
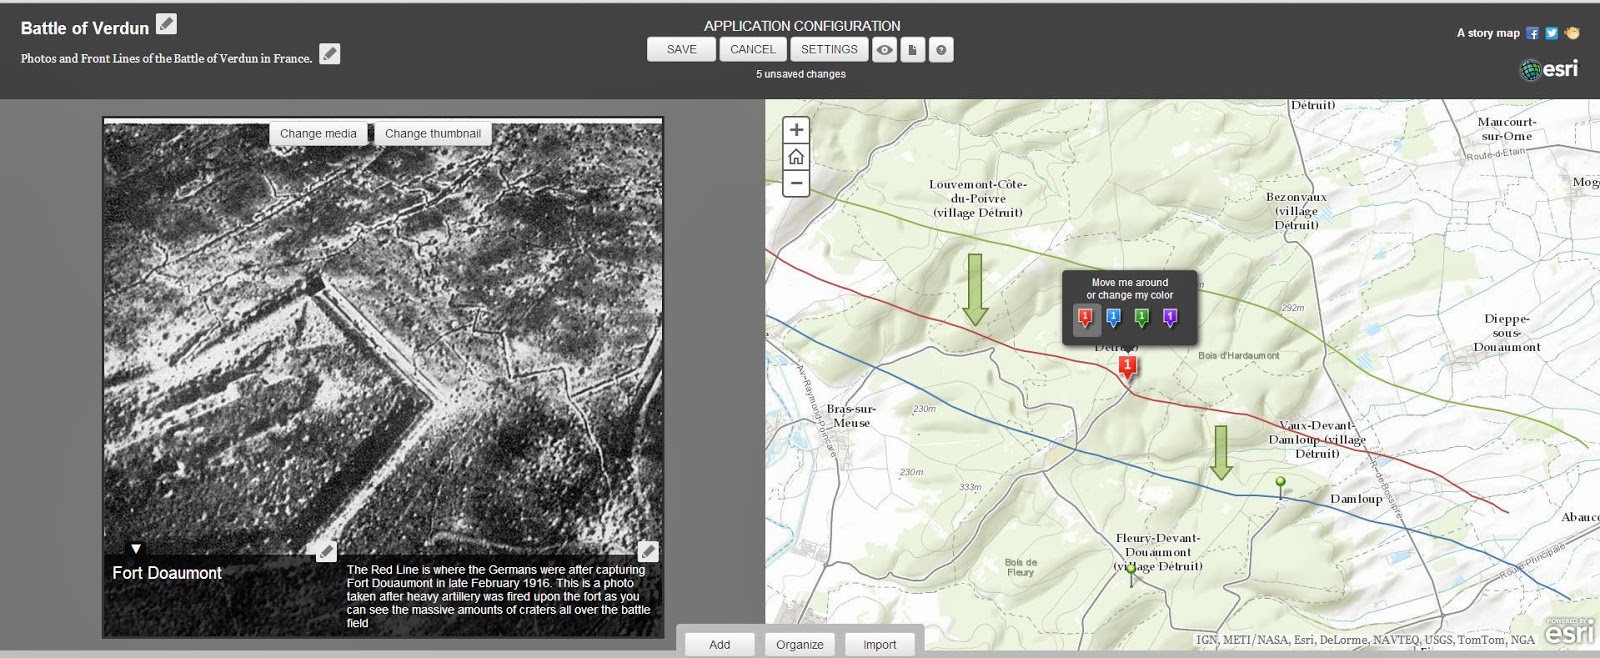
points, lines, and areas to your map.  After adding a point, line, or area a description box should pop up allowing you to add a title, description, and picture to you feature.  You are also able to edit your feature in this pop up box by editing the symbol, the color, transparency, and pattern of your line.  All options are very valuable to you to make your map look professional and presentable.  Make sure to choose good colors and patterns that look good to the eye.  

Example of a pop up box

If you make a mistake and you do not wish to delete the completed area or line you can edit these by clicking on them twice and editing the vertices to change the length or direction of the line or area, a very useful tool.  At any time you can add map notes more map notes to make categories making the legend more clear also continue to save you map making sure no progress has been lost.  After completing the map notes click on the details button to switch out of editing view.  From this view you are able to see your map how it looks in its finished product.  For an example of this please visit my map of the Battle of Verdun

Monday, November 18, 2013

Week 6

Progress

Right now my project is going along smoothly, I will continue to do research on the Battle of Verdun and work on my two maps, the interactive map and the story map with a template.  I have made good progress on my interactive map adding map notes, pictures, and descriptions to the map.  I am still yet to start the story map.  Both maps will cover the same material but in a different format.  

Formats

The first format is what I call an interactive map.  This map allows you for you to draw lines, add points, descriptions, and pictures perfect for describing a War.  Here is the progress of my interactive although this product is not finished I am really liking how it is turning out. 
Progress of my interactive map: Battle of Verdun
 This interactive map allows you to click on the lines, points, and arrows with description boxes popping up next to them.   I am organizing my map through 3 phases of the war each phase getting a different color to make it look organized and easier to read.   The first phase is the Germans advancing to Fort Douaumont, the second phase being the Germans advancing to Fort Vaux and Fleury Village before being stopped.  The final third stage will be France pushing the Germans back and regaining the ground they lost.  If you look to the left of the map you will be able to see contents under that allows you check and uncheck each phase furthering the interactive experience of this map.    Each map will have a description box looking like the picture below.

The second format will be a story map template.  An overview of the template I will be using can be found here.  This template allows for pictures to be displayed much bigger and easier to view.  The template does come with  a map but it will not be interactive.   My story map is yet to really be started but you can view the progress I will be making.    I am going to importing my pictures through Pisca which is run through Google making it easy too add photos to your Google account and then to my map.  This template can be edited in many ways to see all the different ways to edit this template check out my Week 4 blog.

The picture above is an example of what my story map will look like.  So far I only have 1 picture on my story map but eventually the completed map will allow you to scroll through each picture with separate descriptions and locations.

Plan

My plan for this week is continue my research for important historic events, maps, pictures, and other things that will better my two maps.  Also start my story map and start to complete my interactive map. 


Monday, November 11, 2013

Week 5


Progress

I am planing on creating two different story maps.  One being an interactive map on the ArcGIS online Map Page and one using the Story Map Template.  The interactive map will include lines, points marking key events, arrows, and other elements to a good interactive map.  All of these elements will include a description of what happened on this location and some will include a picture.  The Story Map is more for the pictures and it also more professional.  The story map will include the same information as the interactive map but the template will not allow the map to be interactive.   The progress of my story maps has been a lot history of reading and researching.  I am looking for key events, dates, and battle lines during the Battle of Verdun.  My sources will come from books and websites they include: Price of Glory written by Alistar Horne, books written by Christina Hosltien: Fort Douaumont and Fort Vaux, and also the website Western Front Association.  

History Notes 

Below are key history notes from the Battle of Verdun that I will use in creating my interactive and story map.
- Falkenhavns plan was not hand to hand or gun to gun combat but to use heavy artillery on forts and to move the front line forward.  Falkenhayn believed that the French would never fall back out of Verdun so destroying their army was his plan. 
Phase 1
- The Battle of Verdun started at 7:15 a.m. on February 21st 1916.  
-  Heavy snow on the ground and the Germans who had 1 million soldiers in the vicinity were waiting to attack and the French only 250,00 troops.  
-German's first day did not go as planed it took them an entire day to push through french lines and little ground was gained.  Lt. Colonel Driant heroics held the Germans off for awhile until they pushed past Bois des Caures on Feb 21st.  
-By Feb 25th, small amounts of Germans reached Fort Douaumont they Germans destroyed the only big railway out of Verdun and many French Reinforcements were brought in to defend.
-After the French lost Douaumont their strategy became different, a new leader Petain, new commander of the defense of Verdun, ordered to hold Verdun at all costs.  He rotated troops and supplies 24 hours a day and their heavy artillery guns increased from 164 to over 500 and were shelling the Germans at a continuous rate.   
-As the battle continued into March the conditions for the Germans to moved forward were extremely difficult.  The cratered ground and the ground now unthawing and turning into mud made it very hard to walk through.  
-The Germans tried crossing the Meuse and attack but it lead to more deaths as Franz Marc, a German artist, described: "For days I have seen nothing bu the most terrible things that can be painted from a human mind,"
Phase 2
- By March 81,000 Germans had been lost and 89,000 to the French
-In May the French tried some counter attacks to regain ground, but they were not successful as the Germans held their ground.
The Germans attacked Fort Vaux in June and took the fort on June 7th as an epic struggle in pitch darkness.  This would be the limit of the Germans success.
- In the East the Russians attacked more heavily causing Falkenhayn to withdraw some soldiers of Verdun causing the offensive attacks to slow down.  
-After the Germans took Fort Vaux they went on to Fort Souville, the Germans bombarded the fort with  phosgene gas shells but it turned out to not be that effective against the French Gas Masks.     
-June 23rd the Germans obtained the village of Fleury and Thiamont.  
- July 11 30 Germans reached the outside of Fort Souville but no reinforcements came causing them to retreat.  
Phase 3
-As the control of Fleury and Thiamont went back and forth the German commanders decided to fall back to defensive mode
-In late October the French planned to retake Fort Douaumont and on the 25the they were successful by means of heavy artillery fire.  
-November 2nd the French pushed the Germans out of Fort Vaux taking all of the energy out of the German  soldiers as the knew defeat was near.
- December 18 marked the last day of the war as the French pushed the Germans to their original position in February.  The Battle of Verdun was the longest single battle during WWI.  
-French casualties 550,00 to Germans 434,000


-These two maps of front lines during the Battle of Verdun are from the Western Front Association
One Picture that I used to help draw front lines

Another Picture to help me draw my front lines


Story Map Techniques

To create these maps first open up ArcGIS Online and if you have an account go to content and create map.  From here I went to the location of my desired map which is France and started editing my map.  To add map elements, lines, and points like this picture to the right, you must click the add button and add map notes.  I am going to organize my map in 3 phases in the same order of my key events above.   In order to do this in an organized fashion I will add 3 different map notes each labeled Phase 1, 2, and 3.  After adding these maps notes you have the option of putting a description of why each line or point is positioned the way it is.  You are also able to edit the color of each map note and add a photo.  In order to add photo you must have its link and a folder that hosts these photos.  The University 
Description Box: Here you can add a title description, and image
these will all appear on the pop up box when clicking on the point. 
I attend allows me to have this access to a web hosted folder allowing all our pictures to have a link.   The finished product of my interactive map will allow me to click on each point, line, or arrow and having a box pop up having a picture or description of what happened at this location during the Battle of Verdun.    


This is one example of what my finished product will consist of,
this example being Fort Douaumont.  


Goals

My goals in the next two weeks are to keep working on my two different story maps and continue to do research for pictures and front lines.  I am looking for more descriptions of the conditions of the battle and more quotes of terror during the battle.  

Monday, November 4, 2013

Week 4

Story Map

Battle of Verdun will be my story map along with a timeline of where each army was during the war by using lines.  The story map I am going to create will consist of lines drawn on a map to indicate where the German and French were during the battle of Verdun.  Also pictures that I took and pictures that I can find on the Internet to use for my story map.  I am going to do research and read books on the Battle of Verdun to come up with my battle lines and description of what each army was doing during this time.  The Books I will be using are Price of Glory by Alistair Horne, and two Books written Christina Holstein, Fort Vaux and Fort Douaumont.  Also anything else I can find on the Internet to help better my project.  

Template

For my template I am either going to use the regular story map that I first used to make my practice story map (First Story Map).  This one is very easy to use and I am familiar with the program.  The only problem is this map does not have a time line.  I will either have to use ArcMap to edit my Battle Lines or use the add tool in ArcGIS online when creating my map layer.  There is one template that I could use that would fit well for the type of story map I am wanting to create.  It has a timeline that allows you to see different features on the map.  Here it is: (TimeLine map).  This story map (below) is of Civil War Battlefields and as you play the timeline it shows when different battles occurred on the map.  This would be a great template for as I could draw lines on the map of where the French and Germans were during the war.  The only problem I see with this map is the there is no room for pictures and I the user did not have descriptions for each war.  I would definitely want a text box where I could type in descriptions for each front line.  


Techniques

1. Original Story Map: (Overview of story map template).  The first step is to go to ArcGIS online and create a map.  Then being brought to map of the world then zooming in to the correct portion of the world in my case France.  This map feature allows you to create an application of which template you would like.  It also allows you too add layers to your map like, points, lines and anything data from ArcMap you have created.  To create the story map application you must save the map and then share it to everyone.  The next step is to pick a template and publish it. 

-If I am going to use this template I am going to have to draw my lines by using the add feature to edit and draw lines on my map like the picture to right.  The only problem is I have not figure out how to only show one line at a time and make the descriptions of each line show up.  The reason why I like this template so much is you can easily add pictures and descriptions for each picture.  If my template doesn't allow for any pictures I think I will struggle to come up with successful story map. 
up one line at a time.  I do not think that will work that well as a template with time bar would.  The other option is to add layers to my map by Georeferencing and Digitizing my front lines.

The map before making the application.
2. After publishing the template go to its home screen.  Clicking the share button again is a must if you wish to edit your own story map.  Then to open the application you must click open then view application and switch to builder mode. 

Home Page of Template before the application opens
3. From here choosing start from scratch is usually the best option.  You can add the pictures you want later.  In this builder mode you can add pictures by clicking import from Pisca, a CVS template or Facebook.  When you add your pictures you will be able to add a point to the map so it will zoom to that level, very useful when you are doing a map of traveling and have specific sites you visited.  This tool allows the viewer to see where you have been and where it is compared to other places.  This photo below is just an example of what a picture along side its map with the location would look like.  
After adding photos you can see "edit me" which allows you to add descriptions and titles to each photo.  
-Below is an example of what my story map might consist of.  It will have a photo and Front Lines on the map to the right.  In the photo description box I will describe what line the photo matches up with and what is happening in the photo.  I imported this photo through Pisca and then edited the description of the photo.  The Lines and points you see on the right is done by editing the map before you enter the application.


4.  Settings

The settings button allows you to edit your map layout, color, locations, zoom level, and header.  
CSV

This first step in creating a CSV is to download the CSV template which you can find when you create your story map and before you import pictures.  When you download the CSV go to it and enter the information on the excel page.  Picture name, description, color, long, lat, URL, and thumbnail URL.   I created a CSV but I am not sure if I am going to use it I will probably just add my pictures through Pisca.  I found this to be
much easier then to go in and edit your excel sheet.  Plus I could not figure out how to get thumbnail JPEGs. All of the ones I tried on the Internet did not work.  I talked to Lee and he said he made the thumbnails through photoshop, I have not had time for that yet.